

SHELLS MADE FROM CHICKPEAS
Labels
 Very good nutritional quality
 Ultra-processed food and drink products
 Very low environmental impact
Health
Nutrition
Label
Very good nutritional qualityNutrient levels
Fat in moderate quantity (3%)
Saturated fat in low quantity (0%)
Sugars in low quantity (1%)
Salt in low quantity (0.05%)
Nutrition label

Nutrition facts
| Nutrition facts | As sold for 100 g / 100 ml |
|---|---|
| Energy | ~ 933 kJ (339 kcal) |
| FAT | 3 g |
| Saturated fat | 0 g |
| Trans fat | 0 g |
| Carbohydrates | 35 g |
| Sugars | 1 g |
| Added sugars | 0 g |
| Starch | 0 g |
| Dietary fiber | 5 g |
| Soluble fiber | 5 g |
| Insoluble fiber | 9 g |
| Proteins | 11 g |
| Salt | 0.05 g |
| Sodium | 0.02 g |
| Vitamins | |
| Vitamin A | 0 g |
| Vitamin E | 0 g |
| Vitamin K | 0 g |
| Vitamin C | 0 g |
| Vitamin B6 | 0.05 g |
| Minerals | |
| Potassium | 0.52 g |
| Calcium | 0.04 g |
| Phosphorus | 0.27 g |
| Iron | 0.01 g |
| Magnesium | 0.08 g |
| Zinc | 0 g |
| Copper | 0 g |
| Manganese | 0 g |
| Selenium | 0 g |
| Caffeine | 0 g |
| Fruits, vegetables and legumes | ~ 62.5 % |
| Choline | 0 g |
Nutrition facts (Detailed data)
| Nutrition facts | As sold for 100 g / 100 ml | As sold Per 100 g (packaging) | As sold Per 100 g (estimate) |
|---|---|---|---|
| Energy | ~ 933 kJ (339 kcal) | ? (339 kcal) | ? |
| FAT | 3 g | 3 g | ? |
| Saturated fat | 0 g | 0 g | ? |
| Trans fat | 0 g | 0 g | ? |
| Carbohydrates | 35 g | 35 g | ? |
| Sugars | 1 g | 1 g | ? |
| Added sugars | 0 g | 0 g | ~ 0 g |
| Starch | 0 g | 0 g | ? |
| Dietary fiber | 5 g | 5 g | ? |
| Soluble fiber | 5 g | 5 g | ? |
| Insoluble fiber | 9 g | 9 g | ? |
| Proteins | 11 g | 11 g | ? |
| Salt | 0.05 g | 0.05 g | ? |
| Sodium | 0.02 g | 0.02 g | ? |
| Vitamins | |||
| Vitamin A | 0 g | 0 g | ? |
| Vitamin E | 0 g | 0 g | ? |
| Vitamin K | 0 g | 0 g | ? |
| Vitamin C | 0 g | 0 g | ? |
| Vitamin B6 | 0.05 g | 48.21 mg | ? |
| Minerals | |||
| Potassium | 0.52 g | 0.52 g | ? |
| Calcium | 0.04 g | 0.04 g | ? |
| Phosphorus | 0.27 g | 267.86 mg | ? |
| Iron | 0.01 g | 5.36 mg | ? |
| Magnesium | 0.08 g | 80.36 mg | ? |
| Zinc | 0 g | 2.68 mg | ? |
| Copper | 0 g | 0 g | ? |
| Manganese | 0 g | 0 g | ? |
| Selenium | 0 g | 0 g | ? |
| Caffeine | 0 g | 0 g | ? |
| Fruits, vegetables and legumes | ~ 62.5 % | ? | ~ 62.5 % |
| Choline | 0 g | 0 g | ? |
Serving size
Estimated Activity Time
Approximate time needed to burn the energy in 100 g / 100 ml: 933 kJ. Reference adult weight: 70 kg. Energy density: Low.
Ingredients
Ingredients image
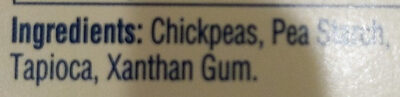
Ingredients list
Ingredient information
Ingredients analysis
No ingredients containing palm oil.
No non-vegan ingredients.
No non-vegetarian ingredients.
Food Processing
NOVA group
Ultra-processed food and drink productsElements that indicate the product is in NOVA group 4
How NOVA works
Additives
E415 - Xanthan gumEmulsifierStabiliserThickener
Xanthan gum (E415) is a natural polysaccharide derived from fermented sugars, often used in the food industry as a thickening and stabilizing agent.
This versatile food additive enhances texture and prevents ingredient separation in a wide range of products, including salad dressings, sauces, and gluten-free baked goods.
It is considered safe for consumption even at high intake amounts.
Environment
Green-Score, origins bonus, and transportation impact are shown for Worldwide .
Green Score
Overall grade
Very low environmental impactAbout Green-Score
Current scope
Life cycle analysis
Average impact of the category
 Dried pasta, gluten-free, raw • Score: 90/100
Life-cycle reference
Overall environmental impact by stage (PEF)
The overall environmental impact figure (PEF) comes from ADEME's Agribalyse database, for the category: Dried pasta, gluten-free, raw. Source: ADEME Agribalyse Database.
| Stage | Impact |
|---|---|
| Agriculture | 58.7 % |
| Processing | 19.9 % |
| Packaging | 2.2 % |
| Transportation | 16.7 % |
| Distribution | 2.7 % |
| Consumption | 0.0 % |
Bonuses and maluses
Declared origins
Packaging impact
Green-Score for this product
Green-Score for this product
Final score: 75/100Final score breakdown
Carbon footprint
Carbon footprint
Climate impact by stage (CO2e)
The carbon emission figure comes from ADEME's Agribalyse database, for the category: Dried pasta, gluten-free, raw. Source: ADEME Agribalyse Database.
| Stage | Impact |
|---|---|
| Agriculture | 43.6 % |
| Processing | 22.5 % |
| Packaging | 4.0 % |
| Transportation | 28.3 % |
| Distribution | 1.9 % |
| Consumption | 0.0 % |
Packaging
Packaging impact
Packaging materials
| Material | % | Packaging weight | Packaging weight per 100 g of product |
|---|---|---|---|
| Paper or cardboard | |||
| Plastic | |||
| Total |
Declared packaging
Transportation
Manufacturing locations
Declared origins
Data Source
Data presented on this page is sourced from the Open Food Facts database. This platform does not alter the original dataset; its purpose is solely to enhance data visualization and user accessibility.
Product added on March 9, 2017 at 2:05:54 PM UTC by usda-ndb-import .
Last edit on March 17, 2026 at 11:29:53 PM UTC by municorn-calorie-counter-app .
Product page also edited by cupcakes, ecoscore-impact-estimator, kaleywhite, kiliweb, macrofactor, municorn-calorie-counter-app, openfoodfacts-contributors, org-database-usda, org-label-non-gmo-project, roboto-app, thaialagata, usda-ndb-import.
Source List
- usda-ndb
- database-usda
- label-non-gmo-project