
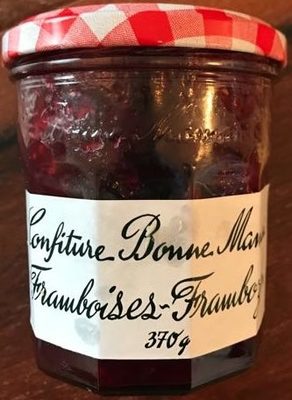
Confiture de Framboises
Labels
 Poor nutritional quality
 Ultra-processed food and drink products
 Moderate environmental impact
Health
Nutrition
Label
Poor nutritional qualityNutrient levels
Fat in low quantity (0.2%)
Saturated fat in low quantity (0%)
Sugars in high quantity (57%)
Salt in low quantity (0%)
Nutrition label
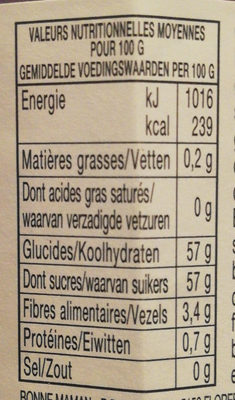
Nutrition facts
| Nutrition facts | As sold for 100 g / 100 ml |
|---|---|
| Energy | 1,016 kJ (239 kcal) |
| FAT | 0.2 g |
| Saturated fat | 0 g |
| Carbohydrates | 57 g |
| Sugars | 57 g |
| Dietary fiber | 3.4 g |
| Proteins | 0.7 g |
| Salt | 0 g |
| Sodium | 0 g |
| Minerals | |
| Fruits, vegetables and legumes | ~ 65 % |
Nutrition facts (Detailed data)
| Nutrition facts | As sold for 100 g / 100 ml | As sold Per 100 g (packaging) | As sold Per 100 g (estimate) |
|---|---|---|---|
| Energy | 1,016 kJ (239 kcal) | 1,016 kJ (239 kcal) | ~ 639.8 kJ (151 kcal) |
| FAT | 0.2 g | 0.2 g | ~ 0.49 g |
| Saturated fat | 0 g | 0 g | ~ 0.08 g |
| Cholesterol | ~ 0 g | ? | ~ 0 g |
| Carbohydrates | 57 g | 57 g | ~ 33.74 g |
| Sugars | 57 g | 57 g | ~ 33.3 g |
| Added sugars | ~ 30 g | ? | ~ 30 g |
| Sucrose | ~ 30.28 g | ? | ~ 30.28 g |
| Glucose | ~ 1.3 g | ? | ~ 1.3 g |
| Fructose | ~ 1.72 g | ? | ~ 1.72 g |
| Galactose | ~ 0 g | ? | ~ 0 g |
| Lactose | ~ 0.06 g | ? | ~ 0.06 g |
| Maltose | ~ 0.06 g | ? | ~ 0.06 g |
| Starch | ~ 0.11 g | ? | ~ 0.11 g |
| Polyols | ~ 0.15 g | ? | ~ 0.15 g |
| Dietary fiber | 3.4 g | 3.4 g | ~ 2.6 g |
| Proteins | 0.7 g | 0.7 g | ~ 0.73 g |
| Salt | 0 g | 0 g | ~ 0.01 g |
| Sodium | 0 g | 0 g | ~ 0 g |
| Alcohol | ~ 0 % vol | ? | ~ 0 % vol |
| Vitamins | |||
| Vitamin A | ~ 0 g | ? | ~ 0 g |
| Beta-carotene | ~ 0 g | ? | ~ 0 g |
| Vitamin D | ~ 0 g | ? | ~ 0 g |
| Vitamin E | ~ 0 g | ? | ~ 0 g |
| Vitamin C | ~ 0.01 g | ? | ~ 0.01 g |
| Vitamin B1 | ~ 0 g | ? | ~ 0 g |
| Vitamin B2 | ~ 0 g | ? | ~ 0 g |
| Vitamin PP | ~ 0 g | ? | ~ 0 g |
| Vitamin B6 | ~ 0 g | ? | ~ 0 g |
| Vitamin B9 | ~ 0 g | ? | ~ 0 g |
| Vitamin B12 | ~ 0 g | ? | ~ 0 g |
| Pantothenic acid | ~ 0 g | ? | ~ 0 g |
| Minerals | |||
| Potassium | ~ 0.11 g | ? | ~ 0.11 g |
| Calcium | ~ 0.01 g | ? | ~ 0.01 g |
| Phosphorus | ~ 0.02 g | ? | ~ 0.02 g |
| Iron | ~ 0 g | ? | ~ 0 g |
| Magnesium | ~ 0.01 g | ? | ~ 0.01 g |
| Zinc | ~ 0 g | ? | ~ 0 g |
| Copper | ~ 0 g | ? | ~ 0 g |
| Manganese | ~ 0 g | ? | ~ 0 g |
| Selenium | ~ 0 g | ? | ~ 0 g |
| Iodine | ~ 0 g | ? | ~ 0 g |
| Fruits, vegetables and legumes | ~ 65 % | ? | ~ 65 % |
| Phylloquinone | ~ 0 g | ? | ~ 0 g |
| Water | ~ 56.76 g | ? | ~ 56.76 g |
Estimated Activity Time
Approximate time needed to burn the energy in 100 g / 100 ml: 1,016 kJ. Reference adult weight: 70 kg. Energy density: Moderate.
Ingredients
Ingredients image
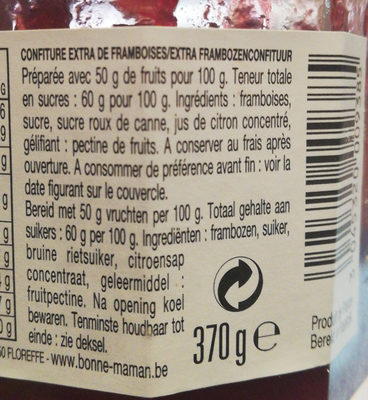
Ingredients list
Ingredient information
Ingredients analysis
No ingredients containing palm oil.
Vegan status unknown
No non-vegetarian ingredients.
Food Processing
NOVA group
Ultra-processed food and drink productsElements that indicate the product is in NOVA group 4
How NOVA works
Additives
E440 - PectinsEmulsifierStabiliserThickener
Pectins (E440) are natural carbohydrates, predominantly found in fruits, that act as gelling agents in the food industry, creating the desirable jelly-like texture in jams, jellies, and marmalades.
Pectins stabilize and thicken various food products, such as desserts, confectioneries, and beverages, ensuring a uniform consistency and quality.
Recognized as safe by various health authorities, pectins have been widely used without notable adverse effects when consumed in typical dietary amounts.
Environment
Green-Score, origins bonus, and transportation impact are shown for Worldwide .
Green Score
Overall grade
Moderate environmental impactAbout Green-Score
Current scope
Life cycle analysis
Average impact of the category
 Jam, raspberry • Score: 69/100
Life-cycle reference
Overall environmental impact by stage (PEF)
The overall environmental impact figure (PEF) comes from ADEME's Agribalyse database, for the category: Jam, raspberry. Source: ADEME Agribalyse Database.
| Stage | Impact |
|---|---|
| Agriculture | 63.2 % |
| Processing | 8.9 % |
| Packaging | 17.4 % |
| Transportation | 8.3 % |
| Distribution | 1.5 % |
| Consumption | 0.7 % |
Bonuses and maluses
Declared origins
Packaging impact
Green-Score for this product
Green-Score for this product
Final score: 54/100Final score breakdown
Carbon footprint
Carbon footprint
Climate impact by stage (CO2e)
The carbon emission figure comes from ADEME's Agribalyse database, for the category: Jam, raspberry. Source: ADEME Agribalyse Database.
| Stage | Impact |
|---|---|
| Agriculture | 42.0 % |
| Processing | 7.1 % |
| Packaging | 33.5 % |
| Transportation | 16.0 % |
| Distribution | 1.2 % |
| Consumption | 0.3 % |
Packaging
Packaging impact
Packaging materials
| Material | % | Packaging weight | Packaging weight per 100 g of product |
|---|---|---|---|
| Glass | |||
| Metal | |||
| Total |
Declared packaging
Data precision
Transportation
Declared origins
Data Source
Data presented on this page is sourced from the Open Food Facts database. This platform does not alter the original dataset; its purpose is solely to enhance data visualization and user accessibility.
Product added on February 26, 2017 at 3:09:10 PM UTC by kiliweb .
Last edit on March 18, 2026 at 12:42:31 AM UTC by new-nutrition-bot .
Product page also edited by countrybot, hdx13, keragui, kiliweb, musarana, naruyoko, new-nutrition-bot, openfoodfacts-contributors, packbot, teolemon.