

Fuze Tea Sabor Limón
Health
Nutrition
Nutri-Score
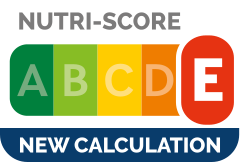 Lower nutritional quality
Nutri-Score data warning
Nutrition label

Nutrition facts
| Nutrition facts | As sold for 100 g / 100 ml | Compared to: Green or white teas |
|---|---|---|
| Energy | 110 kJ (26 kcal) | 33.482 kJ (8 kcal) (+229%) |
| Fat | 0 g | 0.09 g (-100%) |
| Saturated fat | 0 g | 0.02 g (-100%) |
| Carbohydrates | 6.5 g | 1.594 g (+308%) |
| Sugars | 6.5 g | 1.135 g (+473%) |
| Dietary fiber | 0 g | ? |
| Proteins | 0 g | 0.178 g (-100%) |
| Salt | 0.0127 mg | 0.008 g (-100%) |
| Sodium | 0.00508 mg | 0.003 g (-100%) |
| Vitamin PP | 0.0008 mg | ? |
| Vitamin B6 | 0.00005 mg | ? |
| Vitamin B12 | 0.00000005 µg | ? |
| Fruits, vegetables and legumes | ? | ? |
Nutrition facts (Detailed data)
| Nutrition facts | As sold for 100 g / 100 ml | As sold Per serving (legacy) |
|---|---|---|
| Energy | 110 kJ (26 kcal) | 221 kJ (52 kcal) |
| Fat | 0 g | 0 g |
| Saturated fat | 0 g | 0 g |
| Carbohydrates | 6.5 g | 13 g |
| Sugars | 6.5 g | 13 g |
| Dietary fiber | 0 g | 0 g |
| Proteins | 0 g | 0 g |
| Salt | 0.0127 mg | 0.0254 mg |
| Sodium | 0.00508 mg | 0.01016 mg |
| Vitamin PP | 0.0008 mg | 0.0016 mg |
| Vitamin B6 | 0.00005 mg | 0.0001 mg |
| Vitamin B12 | 0.00000005 µg | 0.0000001 µg |
| Fruits, vegetables and legumes | ? | ? |
Serving size
Ingredients
Ingredients image

Ingredients list
Ingredient information
Added sugars
Traces
Ingredients analysis
No ingredients containing palm oil.
Vegan status unknown
Unrecognized: es:concentrado-fuze-tea-sabor-limon, es:camellia-sinesis, es:6-2-mg
Vegetarian status unknown
Unrecognized: es:concentrado-fuze-tea-sabor-limon, es:camellia-sinesis, es:6-2-mg
Food Processing
NOVA group
 Ultra-processed food and drink products
Elements that indicate the product is in NOVA group 4
How NOVA works
Additives
E960 - Steviol glycosides EFSA overexposure risk: moderateSweetener
Steviol glycosides are the chemical compounds responsible for the sweet taste of the leaves of the South American plant Stevia rebaudiana (Asteraceae) and the main ingredients (or precursors) of many sweeteners marketed under the generic name stevia and several trade names. They also occur in the related species Stevia phlebophylla (but in no other species of Stevia) and in the plant Rubus chingii (Rosaceae).Steviol glycosides from Stevia rebaudiana have been reported to be between 30 and 320 times sweeter than sucrose, although there is some disagreement in the technical literature about these numbers. They are heat-stable, pH-stable, and do not ferment. Additionally, they do not induce a glycemic response when ingested, because humans can not metabolize stevia. This makes them attractive as natural sugar substitutes for diabetics and other people on carbohydrate-controlled diets. Steviol glycosides stimulate the insulin secretion through potentiation of the β-cell, preventing high blood glucose after a meal. The acceptable daily intake (ADI) for steviol glycosides, expressed as steviol equivalents, has been established to be 4 mg/kg body weight/day, and is based on no observed effects of a 100 fold higher dose in a rat study.
Environment
Green-Score, origins bonus, and transportation impact are shown for Worldwide .
Green Score
Overall grade
 Very low environmental impact
About Green-Score
Current scope
Life cycle analysis
Average impact of the category
 Tea, brewed, without sugar • Score: 100/100
Life-cycle reference
Overall environmental impact by stage (PEF)
The overall environmental impact figure (PEF) comes from ADEME's Agribalyse database, for the category: Tea, brewed, without sugar. Source: ADEME Agribalyse Database.
| Stage | Impact |
|---|---|
| Agriculture | 62.6 % |
| Processing | 0.0 % |
| Packaging | 1.7 % |
| Transportation | 1.8 % |
| Distribution | 0.3 % |
| Consumption | 33.6 % |
Bonuses and maluses
Origins of ingredients
Packaging impact
Green-Score for this product
Green-Score for this product
Final score: 87/100Final score breakdown
Carbon footprint
Carbon footprint
Climate impact by stage (CO2e)
The carbon emission figure comes from ADEME's Agribalyse database, for the category: Tea, brewed, without sugar. Source: ADEME Agribalyse Database.
| Stage | Impact |
|---|---|
| Agriculture | 58.4 % |
| Processing | 0.0 % |
| Packaging | 6.7 % |
| Transportation | 5.8 % |
| Distribution | 0.4 % |
| Consumption | 28.7 % |
Packaging
Packaging impact
Packaging components
| Shape | Material | Recycling | Impact |
|---|---|---|---|
| Bottle | Plastic | Unknown | High |
Declared packaging
Transportation
Manufacturing locations
Origins of ingredients
Origins breakdown
| Origin | Percent of ingredients | Impact |
|---|---|---|
| Mexico | 100 % | High |
Data Source
Product data comes from Open Food Facts. Food Benchmark also adds translations, category comparisons and explanatory calculations.
The database is licensed under ODbL 1.0, individual contents under DbCL 1.0, and product photos under CC BY-SA 3.0.
Product added on August 21, 2018 at 1:30:30 PM UTC by openfoodfacts-contributors .
Last edit on November 18, 2025 at 7:53:55 AM UTC by foodless .
Product page also edited by foodless, inf, nobeeakon, openfoodfacts-contributors, openfoodfactsmx4, packbot.